Is California wildfire becoming uninsurable?
0 February 10, 2021 at 12:36 pm by Glenn McGillivray
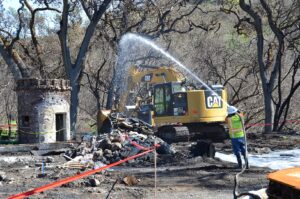
Debris being removed from a private residence in Santa Rosa, Ca. The rock outbuilding left standing had been used as a wine cellar, according to the home owner. The Corps, under the direction of the Federal Emergency Management Agency and in partnership with the California Governor’s Office of Emergency Services, is removing ash and fire-related debris in Northern California following the October 2017 wildfires. (Photo by Mike DeRusha)
From time to time, the global re/insurance industry experiences a loss or series of losses that forces market participants to re-evaluate what they thought they knew about a given hazard.
Three examples of such shock losses are Hurricane Andrew (1992), the terrorist attack of September 11, 2001 (aka 9/11) and the North Atlantic basin hurricane seasons of 2004 and 2005. In future, it may be necessary to add COVID to this list.
Hurricane Andrew, a Cat 5 storm that struck south Florida causing USD 16 billion (1992) in insured losses (USD 29 billion 2020 dollars) drove numerous changes in the industry, many of which still exist to this day. The storm, the costliest ever insured global cat loss up to that time, bankrupt a number of carriers. Many re/insurers were poised to either drop risks en-masse or flee the Florida market altogether. Legislation was passed to staunch the outflow of capacity, in effect, forcing carriers to remain in the market. Andrew prompted the birth of the Bermuda re/insurance market, the vendor modelling industry, and both a state-run insurer and reinsurer of last resort. More on the impacts of Andrew can be found here.
Generating about USD 40 billion in insured losses, the terrorist attack of September 11, 2001 rattled global property, aviation and liability markets worldwide. Despite robust discussions about the potential threat of terrorism, no one foresaw the potential that numerous passenger aircraft could be hijacked and used as missiles. Virtually overnight, terrorism was excluded from most every policy worldwide and a review/re-underwriting of all policies in force and policy wordings was undertaken. In several markets around the world, governments had to step in to insure aircraft, airport facilities and terrorism risk.

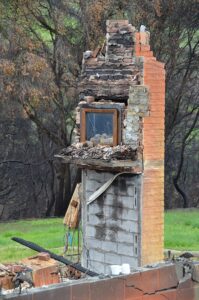
The chimney and the fireplace are all that stands after the Tubbs Wildfire raced through this part of Santa Rosa, Ca. The Corps, under the direction of the Federal Emergency Management Agency and in partnership with the California Governor’s Office of Emergency Services, is removing ash and fire-related debris in Northern California following the October 2017 wildfires. (Photo by Mike DeRusha)
During the active North Atlantic hurricane season of 2004, four major hurricanes struck the U.S. mainland, the first time that had happened in more than 100 years. Of the 16 named storms that year, more than half impacted the U.S. Hurricanes Charlie, Frances, Ivan and Jeanne were particularly nasty, with each impacting Florida in one way or another. Insured damage from the four reached USD 37 billion. Then, in 2005, the U.S. was struck by the now-infamous trio of KRW – Katrina, Rita and Wilma – which together caused more than USD 113.7 billion in insured damage♦. The back-to-back hits of 2004 and 2005 forced carriers to re-evaluate what they thought they knew about North Atlantic hurricane risk. Global cat capacity was reduced and prices increased.
Fast forward to the late 20-teens and the issue is California wildfire.
Twelve wildfires in California between 2017 and 2020 inclusive destroyed almost 37,500 structures. Adding partial losses, smoke damage, vehicles and so on, the fires cost re/insurers a whopping USD 39.9 billion.♥
This, for a hazard considered to be “secondary” in the global property cat market.
The one big difference between recent fire experience in California and the three historical shock losses noted above is that Andrew, 9/11 and the 04/05 hurricane seasons were largely about severity. The changes that came about in the industry as a result of the trio occurred, not because re/insurers were concerned about their becoming commonplace (indeed, after KRW, the U.S mainland didn’t get hit by another major hurricane until Harvey in 2017, 12 years later), but because of the substantial surprise hit they could make on a balance sheet every so often. A hit big enough to impact capital, possibly impacting carrier solvency.
The California wildfires, on the other hand, are about both frequency and severity: A significant number of large fires with heavy insured losses for four consecutive years and, with climate change and other factors, no end in sight.
Now, severity alone can generally be managed (i.e. while extreme tail risk, like with a very large urban earthquake, may require that a government backstop be put in place; the occasional large tornado outbreak, hailstorm or wildfire is generally manageable via sensible accumulation management, conservative reserving practices, adequate cat reinsurance and so on).

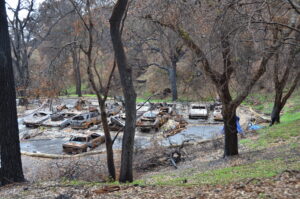
Ten vehicles destroyed during the Tubbs Wildfire inside what had been a storage shelter. Contractors will remove the vehicles after they are cleared by the DMV. The Corps, under the direction of the Federal Emergency Management Agency and in partnership with the California Governor’s Office of Emergency Services, is removing ash and fire-related debris in Northern California following the October 2017 wildfires. (Photo by Mike DeRusha)
But when something begins to become both severe and frequent, it can start to tear at the very fabric that makes a risk insurable. Indeed, of the seven Elements of Insurable Risk several (perhaps, to some degree, all) come into play when considering the question of future insurability of wildfire risk in California.
There are already early signs of an insurance crisis brewing in high-risk parts of the state. In a recent study by the Rand Institute, researchers found evidence that insurers in the admitted market in the state are decreasing market share more rapidly in high risk areas than in lower risk areas. They also found that homeowners in higher risk areas are purchasing policies with lower coverage limits relative to structure value and are opting for higher deductibles “creating coverage adequacy issues” – likely due to premium increases and availability issues.
Other areas of concern include the issuance of a one year moratorium on cancellation or non-renewal of homeowner policies within certain zip codes by the state’s Insurance Commissioner. Some 235,250 property policies were discontinued in California in 2019, a 31% increase from 2018, with the bulk being in areas of high wildfire risk.
Further, there was an increase of 36% from the end of 2018 to the end of 2019 in FAIR Plan policies issued. California’s FAIR Plan, the state’s insurer of last resort, is a pool comprised of all insurers authorized to transact basic property insurance in California. It was created in 1968 after the major wildfires and riots of the 1960s to provide basic fire insurance to property owners who are unable to find coverage in the voluntary market.
If we continue to see highly destructive fire seasons in California going forward, the writing could be on the wall for the viability of a private property insurance market in parts of the state.
As they say, only time will tell. But four consecutive years of major fire losses seem to indicate that a trend is gelling and action will need to be taken by regulators and others to provide a long-term sustainable fix for the problem.
Forcing carriers to remain in an unviable market is not such a solution, but merely a flimsy bandage on a bad burn.
♦ Data graciously provided by Steve Bowen, Aon, Chicago. Figures are in 2020 USD, and include private industry and public entity payouts (like NFIP). They include all country impacts, not just U.S.
♥ Data from Steve Bowen, Aon, Chicago.
Note: By submitting your comments you acknowledge that insBlogs has the right to reproduce, broadcast and publicize those comments or any part thereof in any manner whatsoever. Please note that due to the volume of e-mails we receive, not all comments will be published and those that are published will not be edited. However, all will be carefully read, considered and appreciated.

Leave a Reply